India’s economic narrative is not uniform—it is woven from the diverse growth trajectories of its states and Union Territories (UTs). The Gross State Domestic Product (GSDP) acts as a reliable barometer of this diversity, revealing stark contrasts in economic output across the country. The latest state-wise GSDP data for2024- 2025 brings attention to deep structural differences and potential realignment opportunities in the national economic architecture.
Unequal Economic Geography: The Top Performers
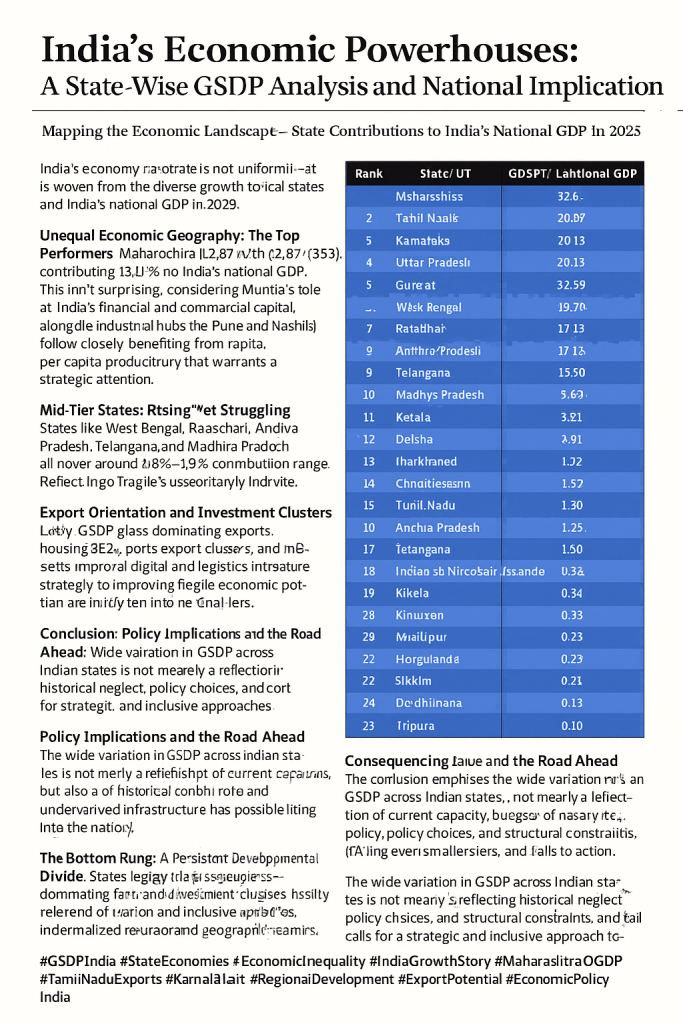
Maharashtra leads with a GSDP of ₹42.67 lakh crore, contributing 13.17% to India’s national GDP. This isn’t surprising, considering Mumbai’s role as India’s financial and commercial capital, alongside industrial hubs like Pune and Nashik. Tamil Nadu (₹30.97 lakh crore; 9.56%) and Karnataka (₹28.13 lakh crore; 8.68%) follow closely, benefiting from robust industrial, IT, and service sectors.
Gujarat (₹27.99 lakh crore) maintains its industrial competitiveness with 8.64% of the national share, while Uttar Pradesh, despite its massive population, contributes a slightly lower 8.22% with ₹26.63 lakh crore—indicating a gap in per capita productivity that warrants strategic attention.
Mid-Tier States: Rising Yet Struggling
States like West Bengal (₹18.76 lakh crore) and Rajasthan (₹17.13 lakh crore) represent a mid-tier bracket. These regions have a rich historical base in trade and agriculture but lag in new-age economic drivers like digital infrastructure or high-value manufacturing. Similarly, Andhra Pradesh, Telangana, and Madhya Pradesh all hover around the 4.6%–4.9% contribution range, reflecting potential that is yet to be fully realized.
Kerala, often celebrated for its human development indicators, contributes only 3.80%, while Delhi, despite being the national capital and a service powerhouse, stands at 3.50%—indicating spatial constraints and saturation in infrastructure as possible limiting factors.
The Bottom Rung: A Persistent Developmental Divide
From Bihar (3.01%) and Odisha (2.91%) to Jharkhand (1.32%) and Chhattisgarh (1.59%), the economic share of several eastern and central states reflects long-standing developmental deficits. These are regions with vast human and natural resources but low industrial penetration, high informal employment, and underutilized infrastructure.
At the extreme end of the spectrum lie the North-Eastern states and small UTs like Tripura (0.10%), Mizoram (0.13%), and Nagaland (0.13%), underlining the fragile economic conditions and geographic isolation that impede integration into the national economic mainstream.
Export Orientation and Investment Clusters
States leading the GSDP rankings also dominate India’s exports. Maharashtra, Tamil Nadu, Gujarat, and Karnataka are not just high-output economies—they house SEZs, ports, export clusters, and are investment magnets for foreign and domestic capital. Their strong performance reflects a well-integrated approach to industrial policy, logistics infrastructure, and digital transformation.
For instance:
Gujarat’s ports power petrochemical and diamond exports.
Karnataka’s software and aerospace sectors cater to global markets.
Tamil Nadu’s automobile and textiles industries are critical to India’s merchandise exports.
These states show that GSDP growth and export potential are tightly linked—but replicating this model requires tailored strategies in less-developed regions.
Policy Implications and the Road Ahead
India’s federal economic map highlights three critical imperatives:
1. Targeted Fiscal Transfers: Central support must be reoriented to boost industrial ecosystems in lagging states, not just welfare support.
2. Decentralized Growth Models: Regional planning should promote city-based clusters, infrastructure-led development, and state-level reforms to make industrial growth inclusive.
3. Digital and Logistics Infrastructure: States that improve ease of doing business and create digital highways will attract more industries and startups—helping even smaller states climb the GSDP ladder.
Bridging the Gap
The wide variation in GSDP across Indian states is not merely a reflection of current capacities, but also of historical neglect, policy choices, and structural constraints. While powerhouse states continue to surge ahead, unlocking India’s true growth potential requires a strategic and inclusive approach that empowers the middle and lower tiers. For policymakers, investors, and citizens alike, this map of economic productivity is a call to action.
#GSDPIndia #StateEconomies #EconomicInequality #IndiaGrowthStory #MaharashtraGDP #TamilNaduExports #KarnatakaIT #RegionalDevelopment #ExportPotential #EconomicPolicyIndia

Leave a comment